
Fix Your Studio’s 90 Day Retention With Cohort Analysis

Cohort analysis groups students by join month, program, or acquisition channel so you can see whether recent changes actually improve retention instead of guessing from a single membership total. The verdict: aggregate numbers hide the story, cohort tables reveal it, and the fastest path to clarity is exporting the last 12 months of joins and building a cohort table this week.
TL;DR:
- Cohort analysis reveals retention trends masked by aggregate numbers, especially when new members join through different channels or programs.
- Building a reliable cohort table requires at least 12 months of clean data, including join date, attendance, billing, and acquisition source.
- Red flags include declining retention in newer cohorts, steep drops between months one and two, and decreasing attendance before cancellations occur.
- Testing targeted operational fixes, such as improved onboarding or attendance nudges, with control groups can increase month-one retention and long-term member lifespan.
- Automating cohort tracking through platforms like Dojotrack minimizes manual effort, provides weekly updates, and detects risks before students cancel.
Table of Contents
- Why Cohort Analysis Matters for Martial Arts Schools
- What Data You Need Before You Build a Cohort Table
- How Do You Build and Read a Cohort Retention Table?
- How Do You Interpret Cohort Curves and Spot Red Flags?
- From Insight to Experiments: A 30–90 Day Retention Playbook
- Operationalizing Cohort Analysis: Workflow and Tools
- Owner Perspective: What Fixing One Weak Cohort Looks Like
- Put Cohort Dashboards and Retention AI to Work
- Sources
- FAQ
Why Cohort Analysis Matters for Martial Arts Schools
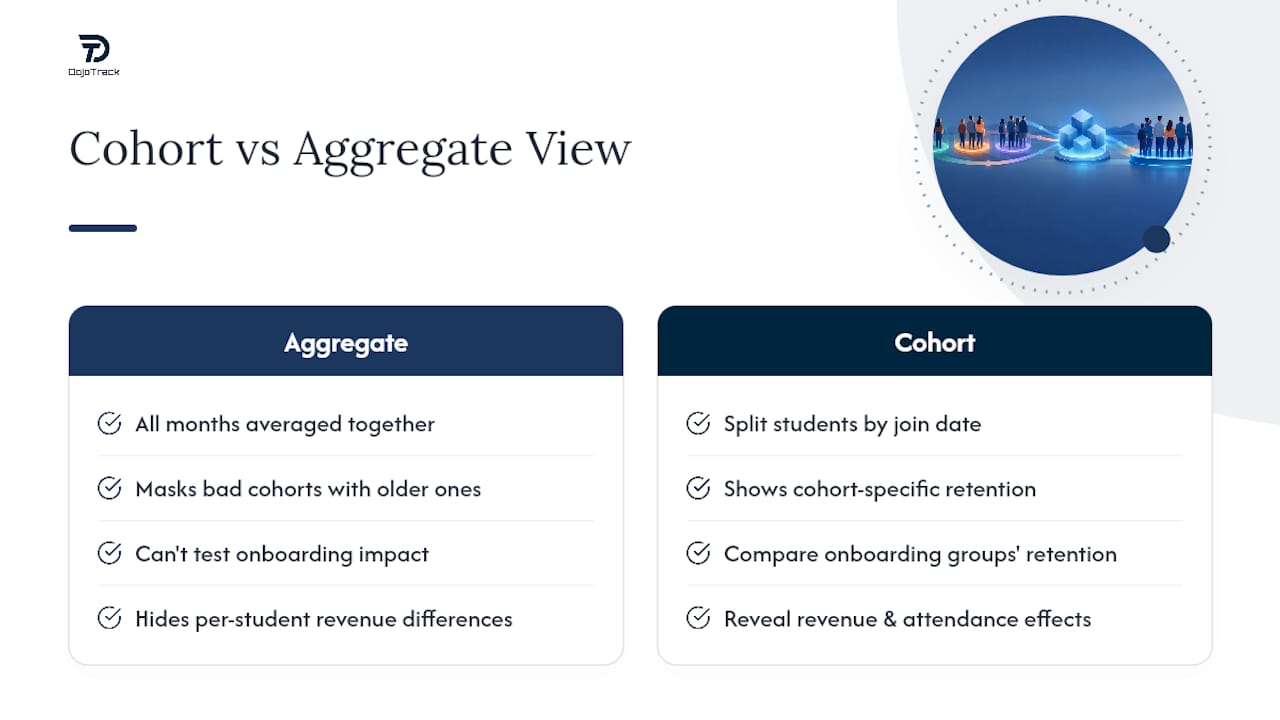
A studio with 300 active students and steady month-over-month totals can look healthy while quietly losing new members faster than ever. Aggregate snapshots average everything together, so a bad cohort is masked by a good one from six months ago. Cohort tables split students by join date and track them separately, which is the only way to see whether the members who signed up after your new onboarding sequence stick around longer than the group before them.
The financial case is just as strong. A survey of over 1,300 martial arts owners found revenue per student typically lands between $100 and $155 depending on school size, and most schools have never tested whether that number can move. Attendance frequency matters even more: members who train rarely quit at roughly double the rate of members training three or more times weekly, according to Gymdesk’s benchmark data. Cohort analysis is how you catch that pattern before it becomes next quarter’s churn number.
What Data You Need Before You Build a Cohort Table
You do not need a data science degree to run this analysis, but you do need to clean, consistent records. Before you touch a spreadsheet, export these fields for every student:
- Member ID (unique identifier, not name, to avoid duplicate confusion)
- Join date and, if applicable, cancellation or freeze date
- Membership or program type (Kids Karate, Adult BJJ, Family Plan, etc.)
- Acquisition channel (referral, Google ad, walk-in, social media)
- Attendance records for each class, dated
- Monthly revenue per member, tied to actual billing, not list price
Set a firm rule for what “active” means. Most schools define it as attended at least one class or made one payment in the trailing 30 days. Decide how you’ll handle family accounts. Do you track each child separately or roll them into one household record? Pick one and stay consistent. Map every lead source to a short list of channel labels. “FB Ad,” “Facebook Ad,” and “fb” are the same channel wearing three disguises. Pull at least 12 months of history in CSV format. Fewer than 12 monthly cohorts will not show you a reliable trend.
How Do You Build and Read a Cohort Retention Table?
Building the table itself takes four steps once your export is clean.
- Assign each student to a cohort based on their join month (January signups form the January cohort, and so on), then calculate “months since join” for every attendance or billing record.
- Calculate retention for each cell. For each cohort and each month offset, divide the number still active by the number who originally joined. Month 0 is always 100 percent by definition.
- Build a heat table with cohorts as rows and months-since-join as columns. Color-code the percentages so decay patterns jump out visually, then overlay the same data as line chart with one line per cohort to spot whether curves are flattening or steepening over time.
- Duplicate the table by segment. Run a version filtered by acquisition channel and another by program type. Referral-sourced cohorts frequently retain 10 to 20 percentage points better at month six than paid-ad cohorts, which changes how you’d budget marketing spend.
Once you have 12 months of cohorts stacked, read down each column first, not just across each row. If month-3 retention is sliding lower with every newer cohort, something in your onboarding or trial process broke recently, and you can usually pinpoint the month it happened.
How Do You Interpret Cohort Curves and Spot Red Flags?
BizMetricsHQ’s industry data puts well-run schools at 22 to 38 months average membership length, with monthly churn in the 2.5% to 6% range depending on program and age group.
Benchmark snapshot: Strong schools retain roughly 72–82% of members annually, corresponding to relatively low monthly churn rates commonly seen in well-managed schools. Anything meaningfully above that band deserves investigation, not a shrug.
Watch for three red flags specifically: retention curves that get worse with each newer cohort (a systemic problem, not a one-off), a steep cliff between month one and month two (usually a trial-to-membership conversion gap), and attendance frequency dropping before the cancellation date shows up. Attendance decline is the leading indicator; the cancellation is just the lagging paperwork. Comparing channel cohorts also tells you which acquisition source produces members worth keeping versus members worth writing off, which is a far better use of ad budget data than raw lead volume.
From Insight to Experiments: A 30–90 Day Retention Playbook
Once your cohort table shows where the leak is, run controlled experiments rather than blanket changes and try proven strategies to increase customer retention for additional guidance. Pick one lever, apply it to new joins only, and compare that cohort against the prior month’s cohort as your control group.
- Onboarding sequence: automated SMS or email touches on day 1, day 7, and day 21 of a new membership.
- Attendance nudges: a message triggered after a student misses two classes in a row.
- Mini-commitment tests: a small deposit or goal-setting session in week one tied to belt progress.
- Failed-payment recovery: an automatic retry and follow-up flow before a lapsed card turns into a cancellation.
Measure each experiment against month-1 retention lift, average weekly visit count, and month-3 retention for that specific cohort compared to the one before it.
Pro Tip: Mark the exact date you launched each change directly on your cohort chart. Most operational fixes take about three months to show a measurable effect, so judging a change after two weeks will make a working fix look like a failure.
Operationalizing Cohort Analysis: Workflow and Tools
Running this manually in a spreadsheet works for a quarter or two. Past that, the weekly maintenance becomes its own part-time job. A repeatable workflow looks like this: attendance gets captured at check-in, cohort tables update automatically overnight, a dashboard surfaces the week’s movement, and any student sliding toward churn triggers an alert before they cancel.
This is precisely the operational gap Dojotrack was built to close. Founder Jared Reed built the platform out of years running martial arts schools himself, which shaped features aimed at exactly this workflow:
- Attendance tracking that feeds cohort data without manual entry
- AI-driven retention scoring that flags at-risk students before they miss a third class
- Automated SMS follow-ups tied to attendance gaps and failed payments
- Studio-specific analytics dashboards built around membership cohorts, not generic CRM fields
The free core layer gives any school the attendance and membership tracking needed to start building cohorts today, with automation and AI scoring available as the studio scales.
Owner Perspective: What Fixing One Weak Cohort Looks Like
One quarter’s cohort table can expose a single broken step. Say your March joins show a steep drop between month one and month two. You add a day-14 check-in call, apply it only to the next cohort, and three months later that cohort’s month-3 retention sits noticeably ahead of March’s. That’s the entire discipline: isolate the weak cohort, test one fix, measure the next group against it.
— DojoTrack
Put Cohort Dashboards and Retention AI to Work
Building cohort tables by hand tells you where the churn is. Dojotrack is the alternative to spreadsheet guesswork for studios that want that answer updated automatically every week, not once a quarter. The platform captures attendance at check-in, refreshes cohort dashboards overnight, flags at-risk students through AI retention scoring before they quit, and runs a failed-payment recovery flow to reduce cancellations. Every plan starts free, with paid tiers (Launch at $95 a month through Master at $245) unlocking deeper automation and SMS follow-ups as your school grows. If you’re migrating from another system, the data migration process is built to bring your student history over without losing the join dates cohort analysis depends on. Sign up free and see your first cohort dashboard populate from your own attendance data.
Sources
- Studio Cohort Analysis: Tracking Whether Each Month’s New Members Stay Longer Than Last Month’s — Zatrovo Blog
- Martial Arts School Benchmarks 2026
- How profitable is a martial arts school? Profit Margin, Owner Salary, Revenue & Valuation | BizMetricsHQ
FAQ
What Is Cohort Analysis in Martial Arts Schools?
Cohort analysis groups students by shared traits, usually join month, program, or acquisition channel, then tracks how each group’s retention changes over time. It exposes trends that a single membership-count snapshot hides, like whether recent joins are quitting faster than joins from six months ago.
How Many Months of Data Do I Need to Start?
Pull at least 12 months of join, attendance, and billing history to build a reliable cohort table. Fewer months make it hard to tell a real trend from normal seasonal noise.
What Is a Good Month-3 Retention Rate for a Martial Arts School?
Healthy studios generally hold meaningful retention at month three, with strong schools tracking toward 72 to 82% annual retention overall. Anything dropping meaningfully under that band by month three usually points to an onboarding gap.
Does Dojotrack Automate Cohort Reporting?
Yes. Dojotrack builds cohort dashboards from attendance and billing data automatically, and its AI retention scoring flags at-risk students before they cancel. Pricing starts with a free plan and scales up through paid tiers as automation needs grow.
How Long Before a Retention Fix Shows Up in Cohort Data?
Most operational changes take about three months to produce a measurable shift in cohort retention curves. Mark the change date on your chart and compare at least three cohorts before judging whether it worked.