

Predicting churn in a martial arts school comes down to watching a small set of signals, attendance frequency, payment health, and engagement, closely enough to score each student’s dropout risk before they vanish. Most schools lose students to a slow fade, not a dramatic exit: three classes a week become one, then none. Catch that pattern early and you can intervene. Small retention gains compound into outsized profit, according to Harvard Business Review’s analysis of customer retention economics.
Here’s what to do in the next 48 to 72 hours:
- Capture last-visit dates for every active student, even if it’s just a spreadsheet column.
- Flag recent payment failures and note how many days they’ve gone unresolved.
- Tag anyone who’s missed two or more consecutive weeks as “at-risk” so nobody falls through the cracks.
Key Takeaways
Predicting churn in a martial arts school works when attendance recency, payment health, and engagement data feed a simple risk score that triggers outreach within 48 hours.
| Point | Details |
|---|---|
| Track four core signals | Monitor attendance recency, payment status, belt progression, and app engagement weekly. |
| Watch the first 30 days | Dropout risk peaks in early enrollment and again right before belt-test windows. |
| Start with rule-based scoring | A simple point system in a spreadsheet catches most at-risk students without any AI. |
| Act within 48 hours | Personalized outreach, SMS, email, or a call, works best right after a flag, not days later. |
| Scale up with Dojotrack | Dojotrack automates attendance capture, risk scoring, and SMS/email outreach once manual tracking becomes unmanageable. |
Table of Contents
- What Predicting Churn Actually Means for Your Dojo
- The Data Signals That Predict Martial Arts Student Churn
- How Churn-Prediction Models Actually Work
- Turning a Risk Score Into Outreach That Works
- Setting Up Your Studio’s Data Collection
- Choosing an Implementation Path That Fits Your Budget
- Why This Changes How I Think About a Slow Monday Night
- How Dojotrack Puts This Playbook on Autopilot
- Sources
- FAQ
What Predicting Churn Actually Means for Your Dojo
Churn prediction is simply using a student’s recent behavior to estimate the odds they’ll cancel or stop showing up. It’s not a guess. It’s pattern recognition applied to data you probably already have sitting in a sign-in sheet or a billing spreadsheet.
Here’s why this matters more than most owners realize. Industry estimates put typical monthly churn for martial arts schools somewhere in the 5% to 10% range, depending on season and program type. That sounds manageable until you compound it. A school losing 8% of its roster every month is losing well over half its student base across a year if it doesn’t keep refilling the funnel. Growth becomes an illusion built entirely on new sign-ups replacing quiet exits.
Statistic to remember: Research on customer retention economics consistently shows that even small improvements in retention disproportionately increase lifetime value. Shaving a few points off your monthly churn rate doesn’t just save a handful of memberships. It compounds, because retained students refer friends, upgrade programs, and buy gear over years instead of months.
The Data Signals That Predict Martial Arts Student Churn
You don’t need a data science degree to spot a student about to quit. You need the right fields tracked consistently, and you need to know what thresholds actually matter.
Primary signals to track:
- Attendance frequency and recency. Days-since-last-visit is the single strongest predictor. A student who trained three times a week for six months and hasn’t shown up in 12 days is telling you something.
- Class-booking behavior. A drop from booking ahead to showing up unannounced (or not at all) often precedes a full stop.
- Payment history. Declined charges, late invoices, or a student who suddenly downgrades their plan are red flags, not administrative noise.
- Belt-test registration and progression. Students who stall before a test window, or skip registering for one they were on track for, are at elevated risk.
- App engagement and message opens. If your studio uses a mobile app, ignored push notifications and unopened messages are early warning signs.
Watch specifically for the first 30 days after enrollment; this is when dropout risk peaks, before habits form. Pre-belt-test windows are another vulnerable stretch, especially for adult students who fear failing publicly. And the classic pattern, three visits a week fading to one, then to zero, usually plays out over four to six weeks before a student goes silent for good.
Secondary signals worth logging: overall membership tenure, how long it took a trial student to convert to paid (slow converts churn faster), a shrinking variety of classes attended, and informal notes from instructors who sense a student disengaging emotionally, even while their attendance numbers still look fine.

Dojotrack’s own product research backs this exact signal set, recommending attendance, billing status, belt progression, and app engagement as the four pillars of any retention model.
Pro Tip: Don’t confuse seasonal absence with disengagement. A parent pulling a kid out for two weeks of summer camp looks identical, on paper, to a student quietly checking out. Cross-reference attendance drops against your school calendar and local school schedules before you flag someone as high-risk. A quick text asking “see you back this week?” resolves the ambiguity faster than any algorithm.
How Churn-Prediction Models Actually Work
You have three tiers to choose from, and none of them require a computer science background to use effectively.
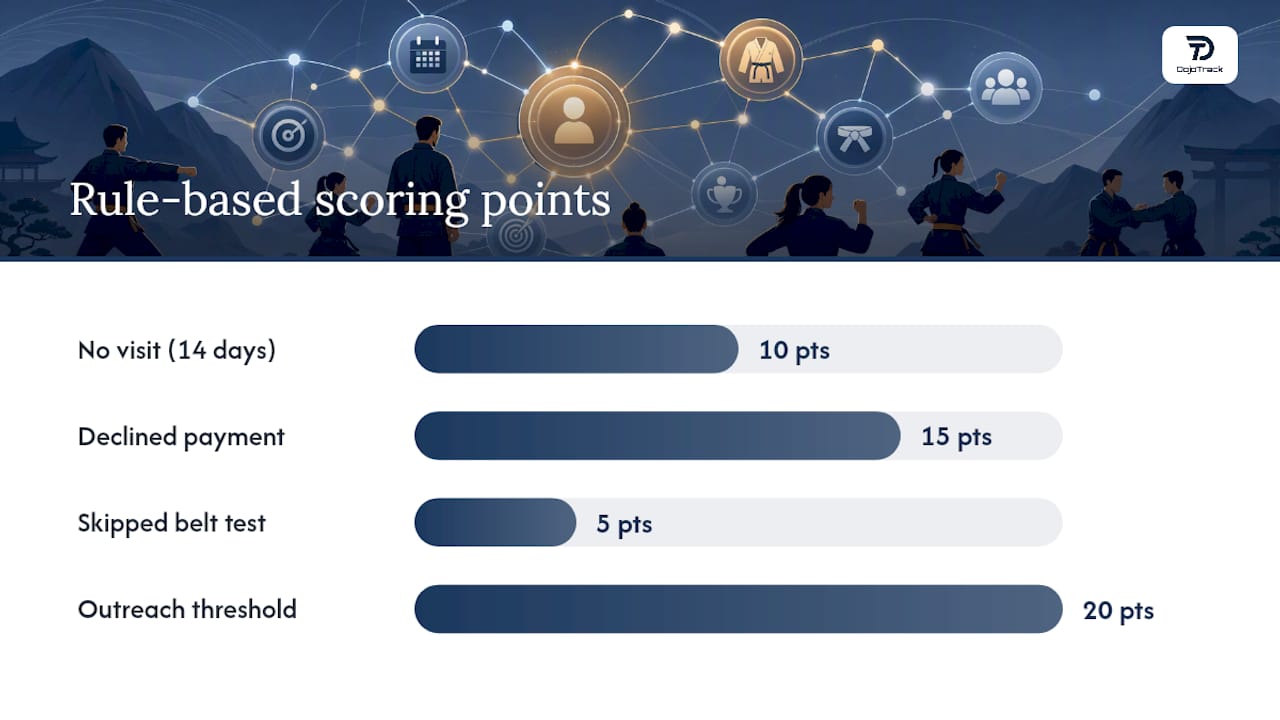
Rule-based scoring is the simplest. You assign points for specific behaviors, say, 10 points for no visit in 14 days, 15 points for a declined payment, 5 points for skipping a belt-test window, and anyone crossing a threshold (like 20 points) gets flagged for outreach. This runs entirely in a spreadsheet and takes an afternoon to set up.
Basic machine-learning models, like logistic regression or decision trees, go a step further by weighting signals based on which ones actually predicted past cancellations at your school. These can run from lightweight tools or even spreadsheet plug-ins once you have a year or two of historical data to train on.
Advanced AI approaches sit at the top of the stack. A 2025 academic study found that hybrid models combining Convolutional Neural Networks with Bidirectional LSTM and time-series analysis can evaluate movement patterns and training progression to flag dropout risk in martial arts populations. This is genuinely sophisticated technology, but it requires labeled video or motion data most single-location schools simply don’t have. If your studio uses video for form-checking, note that biometric or movement data carries its own privacy obligations, so treat consent and storage carefully.
Picture it as a simple pipeline: input signals (attendance, payments, engagement) feed a risk score, and that score sorts students into a low, medium, or high-risk bucket, each with its own outreach playbook.
Turning a Risk Score Into Outreach That Works
A risk score that sits in a spreadsheet unread does nothing. The value comes from what happens in the 48 hours after a student gets flagged.
Follow this sequence every time:
- Detect the risk signal (attendance drop, failed payment, missed belt window).
- Verify it isn’t a false positive, check the calendar, ask an instructor who knows the student.
- Personalize the outreach, referencing something specific (“Haven’t seen you since your last sparring class, everything okay?”).
- Offer a concrete next step, a schedule adjustment, a private lesson, or help resolving a payment issue.
- Measure the outcome and log whether the student returned within two weeks.
Timing matters as much as the message itself. Reach out within 48 hours of an attendance drop crossing your threshold. Send belt-test reminders 14 days before the test window opens, not the day before. And route each situation to the right channel:
- SMS for fast, low-friction re-engagement (“Missed you at class this week, need us to adjust your schedule?”).
- Email for anything involving payment recovery, since it gives students space to update card details privately.
- A direct instructor call for your highest-risk students, especially those close to a belt test or with long tenure worth protecting.
Dojotrack’s guide on boosting retention and revenue outlines five practical steps along these same lines, outreach templates, scheduling flexibility, short-term offers, payment recovery, and instructor check-ins.
Measuring success doesn’t require statistics jargon. Two numbers matter: precision (of the students you flagged, how many were actually at risk) and recall (of the students who eventually left, how many did you flag in time). Track your monthly churn rate before and after you start intervening, and log recovered revenue from students who stayed after outreach. Vendors in this space have reported churn reductions in the 20% to 40% range after implementing automated attendance-drop alerts, though results vary by school and should be treated as directional rather than guaranteed.
Setting Up Your Studio’s Data Collection
Good predictions start with clean data. Here’s the minimum field set every school needs, regardless of size:
- Student ID and enrollment date.
- Last-visit date plus visit counts across 30, 60, and 90-day windows.
- Payment status, including the date of the last failed or late payment.
- Belt level and next scheduled test window.
- App engagement timestamp, if you offer a mobile app.
- Trial start and end dates, for students not yet converted to paid membership.
You have four practical ways to capture this: a kiosk check-in system at the front desk, instructor-marked attendance taken at the start of class, a student mobile app that logs visits automatically, or a manual spreadsheet for very small schools just starting out. Dojotrack’s walkthrough on tracking student attendance breaks down the tradeoffs between each method in more depth. Whichever method you choose, consistency matters more than sophistication, a simple spreadsheet updated daily beats a fancy system nobody maintains.
Choosing an Implementation Path That Fits Your Budget
Match your approach to where your school actually is today, not where you wish it were.
- Small school, thin on time: Run a manual point-based score weekly in a spreadsheet. Twenty minutes on a Monday morning catches most of your at-risk students.
- Growing school with some technical comfort: Layer in lightweight automation through CRM integrations that flag attendance gaps and payment issues automatically.
- Multi-location or fast-scaling schools: A purpose-built platform like Dojotrack combines attendance capture, billing recovery, risk scoring, and SMS or email automation into one system, so nothing depends on someone remembering to update a spreadsheet.
Consider a school with 200 students at $150 a month; trimming monthly churn from 8% to 5% preserves roughly $900 in monthly recurring revenue, an illustrative figure, but one that shows how a small percentage shift pays for a management platform many times over within a year.
What the 2025 Retention Research Actually Found
A 2025 study in predictive decision analytics tested whether hybrid AI models could detect martial-arts dropout risk from movement and training data.
The researchers found that combining Convolutional Neural Networks with Bidirectional LSTM and time-series analysis let them evaluate a learner’s movement patterns and training progression against expert benchmarks, surfacing engagement signals invisible to simple attendance tracking.
Unless your school has large labeled video datasets, this level of sophistication belongs to bigger franchises or research partnerships. Start with attendance, payment, and progression data first; it covers most of the predictive value at a fraction of the complexity.
Why This Changes How I Think About a Slow Monday Night
A quiet Tuesday class used to just feel like bad luck. Once you’re tracking attendance recency and payment status side by side, that same quiet class becomes three specific names you can text before the week ends. The time investment is real, someone has to own the data and the outreach, but it’s a fraction of what it costs to backfill a lost student through new lead generation. Automation earns its keep the moment your roster crosses roughly 75 to 100 active students, past that point, manual tracking starts missing people.
How Dojotrack Puts This Playbook on Autopilot
Everything covered above, attendance capture, payment tracking, belt progression, and engagement scoring, is exactly what Dojotrack was built to run automatically instead of manually. The platform pulls attendance data from kiosk check-ins or the student app, flags failed payments the moment they happen, and generates a risk score without you touching a spreadsheet. When a student crosses your risk threshold, automated SMS and email templates go out on the timing windows that matter, no instructor has to remember to send a “haven’t seen you lately” text at 11pm.
You can start on Dojotrack’s free core tier if you’re just digitizing attendance and membership records for the first time. Upgrading to the AI-driven automation and risk-scoring layer makes sense once you’re managing more students than you can personally track by memory, typically once your active roster passes the point where a spreadsheet review takes longer than 20 minutes. Most schools see their first automated save, a re-engaged student who would have quietly quit, within the first billing cycle after setup. Sign up for Dojotrack and get your attendance and billing data connected today.
Sources
- Predictive Decision Analytics for Membership Retention and Expansion in Martial Arts Organisations
- The Value of Keeping the Right Customers | Harvard Business Review
FAQ
What Is Churn Prediction and How Does It Work?
Churn prediction uses a student’s recent behavior, attendance, payments, engagement, to estimate how likely they are to cancel. Schools assign risk points to specific patterns, like missed classes or failed payments, then intervene once a student crosses a threshold.
What Does a 20% Churn Rate Mean for a Dojo?
A 20% monthly churn rate means one in five students leaves each month, far above the typical 5% to 10% range most schools see. At that rate, a school would need to replace its entire roster roughly every five months just to stay flat.
How Do I Build a Simple Churn Prediction Model?
Start by scoring points for specific risk behaviors, missed visits, late payments, skipped belt tests, in a spreadsheet, then flag anyone above a set threshold for outreach. Platforms like Dojotrack automate this scoring once manual tracking becomes too time-consuming.
What Does Churn Mean in Simple Terms?
Churn is the rate at which paying students cancel or stop attending over a given period, usually measured monthly. It’s the opposite of retention, and lowering it even slightly can meaningfully improve a school’s profitability over time.