

TL;DR:
- Academic analytics involves collecting student data to improve educational outcomes through informed decisions. Schools focusing on core metrics like attendance, grades, and behavior can identify at-risk students early and tailor interventions effectively. Successful implementation depends on choosing user-friendly tools, fostering a positive data culture, and maintaining regular review cycles.
Academic analytics is defined as the systematic collection and analysis of student data to inform educational decisions and improve outcomes. School leaders who use analytics to improve school performance gain a clear view of where students struggle, which interventions work, and how to allocate resources where they matter most. Research confirms that personalized learning technologies significantly enhance student performance and retention across institutions. The standard industry term for this practice is data-driven instruction, and it sits at the center of every high-performing school improvement plan today.
What types of data and metrics should schools focus on?
Schools that track too many metrics track none of them well. The most effective approach starts with a minimal viable data set built around three core categories: attendance, core subject grades, and behavior logs. These three indicators predict academic risk faster than any complex dashboard ever will.
Prioritizing data means matching metrics to your specific school goals. A school focused on reading proficiency tracks Lexile score trends and reading assessment results. A school targeting graduation rates monitors credit accumulation and chronic absenteeism. The data you collect must answer a question your leadership team is actually asking.
Quantitative data tells you what is happening. Qualitative data tells you why. Combining both gives you the full picture. Teacher observation notes, student surveys, and counselor records add context that attendance numbers alone cannot provide. A student who misses class three times a week may be dealing with a transportation issue, a health condition, or a scheduling conflict. The number flags the problem. The conversation reveals the cause.
- Attendance rates: Track daily and chronic absenteeism separately. Chronic absence (missing 10% or more of school days) is one of the strongest early warning indicators.
- Core subject grades: Monitor grade trends over time, not just current snapshots. A student dropping from a B to a D over six weeks signals a problem before failure occurs.
- Behavior logs: Discipline referrals and classroom behavior data reveal patterns that academic grades miss entirely.
- Assessment results: Formative assessment scores, not just summative tests, show where skill gaps exist right now.
- Engagement indicators: Participation rates, assignment completion, and extracurricular involvement round out the picture.
Pro Tip: Limit your school’s core dashboard to five or fewer metrics. Staff who see 20 data points on a screen disengage. Five clear indicators drive focused conversations and faster decisions.
How can schools implement analytics tools for real results?
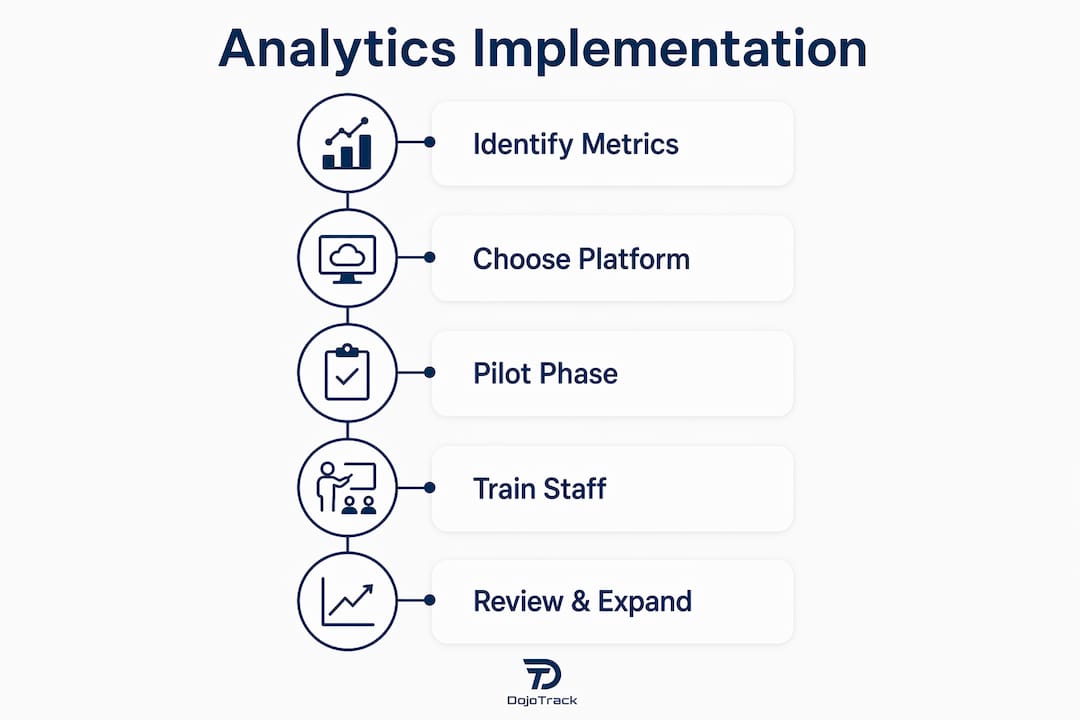
Choosing the right analytics platform is a decision about usability first and features second. A tool that teachers find confusing will sit unused within a semester. The platform must surface insights in plain language, not raw data tables that require a statistician to interpret.

When evaluating analytics software, focus on these feature categories:
| Feature category | Why it matters |
|---|---|
| Integration with existing systems | Pulls data from your gradebook and LMS automatically, reducing manual entry |
| Customizable dashboards | Lets each user see the metrics relevant to their role |
| Early warning alerts | Flags at-risk students before a crisis develops |
| Reporting and export tools | Supports communication with parents, boards, and district leadership |
| User access controls | Protects student privacy while giving staff appropriate visibility |
Integration with your existing learning management system is non-negotiable. A platform that requires teachers to log into a separate system and re-enter data will fail. The best implementations connect directly to grading tools, attendance systems, and student information systems so data flows automatically.
Teacher training is where most implementations break down. Staff need to see analytics as an aid to their work, not an audit of it. Shifting teacher perception from data as a punitive tool toward data as a workload reducer is the single most important cultural move a school leader can make.
Pro Tip: Run a 90-day pilot with one grade level or department before a school-wide rollout. Collect honest feedback from teachers, fix friction points, and let early adopters become your internal champions.
What strategies maximize analytics impact on learning outcomes?
The most powerful use of school analytics is identifying at-risk students before they fail, not after. Predictive analytics models use attendance trends, grade trajectories, and behavior patterns to flag students who need support weeks before a crisis becomes visible to the naked eye.
-
Build dynamic student groups. Use current assessment data to form small, flexible instructional groups. Effective data-driven instruction uses these groups to differentiate teaching and avoid one-size-fits-all models that leave struggling students behind.
-
Pair predictive alerts with human review. Successful districts do not act on automated flags alone. They pair analytic alerts with human review cycles to understand the root cause behind each flag before designing an intervention.
-
Integrate AI tutoring with structured support. Research shows that AI-supported tutoring strengthens metacognitive regulation and behavioral engagement, leading to better knowledge transfer. The key word is “supported.” AI tutoring works when teachers guide how students use it.
-
Use personalized GenAI agents carefully. A pilot study with 139 undergraduate students found that personalized GenAI academic agents produced statistically significant improvements in student perceptions of their own learning. That result matters because student confidence directly affects persistence.
-
Review and adjust on a cycle. Set a fixed review cadence, whether weekly, biweekly, or monthly, and stick to it. Data that is reviewed once and then forgotten drives no improvement at all.
Pro Tip: Never let an algorithm make the final call on a student intervention. Use the data to start the conversation, then let an educator, counselor, or administrator make the decision with full context.
How to build a data-positive culture among educators
The biggest barrier to analytics adoption is not technology. It is fear. Teachers worry that data will be used to evaluate their performance rather than support their students. That fear is rational, and school leaders who ignore it will watch their analytics programs stall.
Most barriers in school data use are cultural, with teachers fearing punitive use of their classroom results. Changing that narrative requires consistent, visible leadership behavior. When principals share their own data in staff meetings and talk openly about what it reveals, teachers begin to see data as a shared tool rather than a surveillance system.
- Reframe the message. Present analytics as an early warning system that reduces teacher workload, not as a report card on teacher effectiveness.
- Hold regular collaborative data meetings. Regular collaborative data review meetings where teachers discuss root causes behind the numbers lead to more targeted and effective interventions.
- Celebrate data wins publicly. When a team uses data to identify a struggling student and that student improves, share that story. Positive examples build trust faster than any policy document.
- Give teachers agency. Let teachers choose which metrics they track for their own classrooms. Autonomy reduces resistance and increases engagement with the data.
- Model data use at the leadership level. Administrators who reference data in every decision signal that analytics is a core part of how the school operates, not a passing initiative.
Data should empower educators to identify specific skill gaps and adjust instruction with precision. When teachers believe that, adoption follows naturally.
What are common pitfalls when using analytics in schools?
The most common mistake schools make is tracking too many metrics at once. A dashboard with 30 data points creates paralysis, not clarity. Staff spend their time managing data instead of responding to it.
- Overtracking: Limit your core dashboard to five or fewer metrics. Add new indicators only after your team has built confidence with the basics.
- Unguided AI use: Research is clear that unguided AI use does not improve and may negatively affect student problem-solving skills. Structured pedagogical frameworks are not optional. They are the mechanism through which AI produces results.
- Skipping professional development: Analytics tools require ongoing training, not a one-time orientation. Build quarterly training into your implementation plan from day one.
- Ignoring engagement as a metric: Student engagement mediates the relationship between analytics interventions and academic performance. A student who is present but disengaged will not respond to data-driven instruction.
- Treating analytics as a one-time project: School performance improvement through data is an iterative process. Build in formal review points every semester to assess what is working and what needs adjustment.
“Access to technology alone is insufficient. Without structured guidance, AI can harm performance, especially in complex problem-solving tasks.”
That finding applies equally to analytics platforms. The tool is only as good as the process built around it.
Key takeaways
Using analytics to improve school performance requires a focused data set, structured AI integration, and a school culture that treats data as a support tool rather than a judgment system.
| Point | Details |
|---|---|
| Start with a minimal data set | Track attendance, core grades, and behavior logs before adding any other metrics. |
| Choose usable tools | Select platforms that integrate with existing systems and surface insights in plain language. |
| Pair AI with human review | Automated alerts work best when educators review and contextualize each flag before acting. |
| Build a data-positive culture | Reframe analytics as a workload reducer and early warning system to reduce teacher resistance. |
| Review on a fixed cycle | Set a regular cadence for data review meetings and adjust interventions based on what the data shows. |
What we have learned from watching schools adopt analytics
Running a school is not unlike running any student-centered organization. You have limited time, limited staff, and unlimited pressure to show results. What I have seen consistently is that schools which succeed with analytics do one thing differently from those that fail. They start small and stay disciplined about it.
The temptation to buy a powerful platform and turn on every feature at once is real. Leadership teams feel pressure to show progress quickly, and a full dashboard looks impressive in a board presentation. But teachers who face 20 new metrics on top of their existing workload do not engage with any of them. The schools that build lasting analytics programs start with three metrics, master them, and add more only when the team asks for more.
The second lesson is harder to accept. Technology does not fix culture. I have watched schools invest in excellent analytics platforms and see zero improvement because the staff believed the data would be used against them. The platform was not the problem. The trust was. School leaders who spend as much time on culture as they do on software selection get dramatically better results.
The third lesson is about patience. Analytics-driven improvement is not a quarter-long initiative. It is a multi-year shift in how a school makes decisions. Leaders who communicate that timeline honestly, and who celebrate small wins along the way, build the momentum that sustains the program past the first year.
— Dojotrack
How Dojotrack supports performance-focused school programs
Dojotrack’s AI-powered analytics platform gives school program administrators real-time visibility into student attendance, engagement, and retention patterns. The platform’s AI-driven retention system identifies students at risk of dropping out before the problem becomes a crisis, giving instructors time to intervene with targeted support. Dojotrack also tracks curriculum progress at the individual student level, so administrators can see exactly where each student stands without manual reporting. For school leaders who want to put attendance data to work for student retention, Dojotrack provides the structure and automation to make that happen consistently.
FAQ
What is academic analytics in education?
Academic analytics is the collection and analysis of student data, including attendance, grades, and behavior, to inform instructional decisions and improve school outcomes.
How do schools start using data-driven instruction?
Schools start by identifying three to five core metrics tied to specific academic goals, then building a regular review cycle where teachers and administrators discuss what the data reveals.
What is a minimal viable data set for schools?
A minimal viable data set focuses on attendance rates, core subject grades, and behavior logs. These three indicators predict academic risk faster than larger, more complex data collections.
How does AI improve student performance in schools?
Structured AI tutoring and personalized learning agents improve student engagement and metacognitive skills, but only when educators provide a clear pedagogical framework for how students use the tools.
Why do analytics programs fail in schools?
Most analytics programs fail because of cultural resistance, not technology. Teachers who fear punitive data use disengage from the tools, and without teacher engagement, no analytics platform produces results.